Pages

Sunday, 17 August 2014

Modelling the #Indyref outcome probabilities

Given the latest poll-of-poll results (courtesy of @WhatScotsThink on Twitter) and the betting exchange implied probabilities (courtesy of @neiledwardlovat on Twitter) pertaining to the upcoming Scottish Independence Referendum, I thought it would be interesting to combine these sources of information into (approximate) probability density functions for YES and for NO, respectively.

Meaningful criteria for the approximate probability distributions


In advance of the actual referendum on 18 September 2014 (which will settle the matter once and for all), assume that the proportion of voters who will vote YES can be modelled as a random variable, denoted Y. Likewise, for the proportion of voters who will vote NO, denoted N. Although the true probability density functions for these random variables are fundamentally unknown, meaningful estimates of the distributions can be derived given that they should reasonably satisfy the following criteria:

  • The Expected Value (approximated by the Mean or Average) of the given distribution should reflect the result of the aggregate of all the official polls conducted to date. Note: this criterion is only justifiable if the polls can be considered as truly representative of the actual full voting population. This is, of course, a highly debatable assertion, one extreme view being that "opinion polls are meaningless". But for the sake of current argument, the assertion that the polls are indeed representative, will be considered as valid.
  • The integral of the distribution (or "area under the probability density function" or "cumulative density function (cdf)") evaluated over the range from 0.5 to 1 (50% to 100%) should correspond to the implied probabilities ("chance of YES winning", and "chance of NO winning", respectively) from the betting exchange data. It could be viewed that this is a considerably less justifiable criterion than the previous, but on the basis that "the bookies are seldom wrong", it seems like quite a reasonable assertion. After all, the betting exchange data is "crowd-sourced" in that it reflects the combined "beliefs" of many thousands of punters, i.e.,  potential voters. Also, there is no other readily available source of such information, with the exception of the polling data itself (utilised in the previous criterion). However, modelling probability distributions on just the polling data would lead to much narrower distributions (i.e., suggesting considerably less uncertainty) than implied from the betting exchange data. Or put another way, the betting exchange data in effect incorporates the (potentially real) broader uncertainties than captured in the polling data alone. 

The Beta Distribution


Since the probability distributions for Y and N are fundamentally unknown, we are free to build models which meet the criteria presented above. A good candidate is the Beta Distribution which is often used for the purpose at hand, i.e., to devise a meaningful probability distribution for election outcomes involving two choices. One of the benefits of using the Beta Distribution  is that it is formally (structurally) similar to the Binomial Distribution which is widely used for modelling polling results. Taken together, these two distributions can be combined via Bayesian Inference to provide an updated-distribution-after-most-recent-poll which, is itself a Beta Distribution. This useful and interesting aspect will not be pursued at present. 

The Beta Distribution has two parameters, denoted A ("alpha") and B ("beta"). The numerical size of these determines the sharpness/certainty (or broadness/uncertainty) with large numerical values representing narrow distributions (i.e., with more certainty), and smaller numerical values representing broad distributions (i.e., with more uncertainty). Also, if A and B are numerically equal, the distribution is symmetric about a Mean value of 0.5 (50%). Unequal values for  A and B allow for skewed (non-symmetric) distributions with Mean values different from 0.5.

By trial-and-error, it is straightforward to determine the parameters (A, B) for the Beta Distributions which satisfy the criteria described earlier for both YES and NO. The results of these parameterisations are presented in the distributions below.

Probability Density Function (pdf) for YES


Probability Density Function (pdf) of a Beta Distribution parameterised (with A=21, B=27.89) to represent the random variable Y (or YES) based on polling data and betting exchange data as of 17 August 2014.  The Mean of the distribution (indicated by the dotted vertical line) is 0.43 corresponding to the poll-of-polls data which suggests that 43% will vote YES. The cumulative density evaluated from 0.5 to 1 (i.e., the area of the blue shaded region)  representing the probability that Y will exceed 0.5 i.e., that YES will win, is 0.15  in accordance with the 15% implied probability from the betting exchange data.

Probability Density Function (pdf) for NO


Probability Density Function (pdf) of a Beta Distribution parameterised (with A=30.3, B=22.81) to represent the random variable N (or NO) based on polling data and betting exchange data as of 17 August 2014.  The Mean of the distribution (indicated by the dotted vertical line) is 0.57 corresponding to the poll-of-polls data which suggests that 57% will vote NO. The cumulative density evaluated from 0.5 to 1 (i.e., the area of the blue shaded region)  representing the probability that N will exceed 0.5 i.e., that NO will win, is 0.86  in accordance with the 86% implied probability from the betting exchange data.

What are these good for ?


I would suggest that these approximate distributions, derived in accordance with the criteria presented, might be useful for anybody interested in exploring the statistics of #Indyref.  For example, if you are inclined to build a Bayesian Inference model for monitoring how the probabilities evolve following successive polls in the days leading up to 18 September 2014, these distributions might serve as usable "priors". Then again, all must be taken with a (large?) pinch of salt, since the assumptions and data used for deriving the distributions, by their very nature, may turn out to be non-valid :-)

Thursday, 24 July 2014

iNavCalc and Bulldog-Weight-and-Balance for Fire Phone

Delighted to announce that my free apps iNavCalc and Bulldog-Weight-and-Balance have just been approved by Amazon for their newly announced Kindle Fire Phone, giving you even more choice of platforms

Saturday, 19 July 2014

Get METARs and TAFs nearest to me or anywhere!

How often do you find yourself wondering what the aviation weather reports (METARs and TAFs)  look like nearest to your current location ? Or nearest to any other location you happen to be interested in ?

Really-Simple-Moving-Map (RSMM) gives you the answer to both with one click. Simply click on the RSMM map at either your current location or anywhere else (in the world!). The popup window contains, amongst other things, METAR & TAF briefings for the nearest reporting stations, ordered by closest first. You can adjust (via Options->Info on Marker Popups) the number of stations to report and whether or not to include decoded as well as raw briefings.

A detailed RSMM Users' Guide can be found here.

[Note: to enable the METAR & TAF functionality, you need to be a registered user. Registration is FREE].

Sunday, 1 June 2014

Chasing the Sun

For some reason, I've always been interested in the geometrical details of how the Sun tracks across the Earth for a given location and season. Some years ago I wrote the software which calculates all of this. [Users of iNavCalc may recognise the output of this effort in terms of the Sun angle calculations presented along a given flight route].

Considering that this topic may be of wider interest beyond pilots and #avgeeks, I've now built the functionality into #reallysimplemovingmap. Simply click anywhere on the map (or on any existing Marker). The usual Marker Info window will open:


You will see there is a (new) Sundial link. Click on this to open the Sundial window:

  
...which shows the  track of the Sun across the sky today for the selected location. The highlighted value corresponds to the position of the Sun right now (i.e., at the point in time when the Sundial link was clicked). Clicking anywhere on the trajectory shows the Sun position at that point on the trajectory (in terms of time, direction --true and magnetic, & height above horizon).

Hope you find it as fun and useful as I do. It is interesting to explore the polar regions, especially those in perpetual light or darkness. Fond memories of a fishing expedition to Alaska one August, when the Sun never set.


Sunday, 11 May 2014

Announcing Really Simple Moving Map

Over the past few months with my aircraft grounded (during it's C-of-A renewal, now done, thankfully !) and with the weather basically rubbish (around the UK) , I took the opportunity to explore the world of HTML5 cross-platform web-app programming.

As a "test app", I chose to put  together a "moving map", inspired by my interest in aviation and navigation, but also because the available mapping & navigation apps on Android, iOS etc never quite seemed to do what I want.

The first step was to select a mapping technology. One thing that became apparent early in the development was that I couldn't use GoogleMaps for this: the licensing from Google forbids the use of the GoogleMaps API for "real time" navigation applications. This was initially disappointing because I'd built up a fair working knowledge of the GoogleMaps API (as used in iNavCalc). However, in the end I'm grateful for the forced change: it led me to discover OpenStreetMap and leaflet.js , two open-source resources which are a delight to work with, and, moreover,  have none of the licensing restrictions of GoogleMaps.

I should emphasise that my goal was not to substitute my assorted "real" navigation devices with this "toy" web app. The limitations of web-technology preclude the use of such a web app for serious navigation -- not least since much of navigation takes place where there is no internet connection. Web apps -- by definition -- require a more or less continuous internet connection to function in their full glory, this one no exception.

That said, as I've been putting the app together and "field testing" it, I've been surprised how well it works in unlikely places e.g., hiking in the local hills (on the Isle of Man), skiing in Norway, sitting on airliners etc.. Of course, on the airliners, it only works until the 3G/4G/WiFi signal falls away, typically a few hundred feet into the air. I've also tried the app using the on-board WiFi signal that many airlines now offer. No joy -- not surprising, really, since the location services require triangulation i.e., more than one transmitter, and so the single WiFi hotspot on-board doesn't suffice.

On the subject of flying, I've not yet tried my new app "in the cockpit", so to speak. But now that I've got my C-of-A renewed, and the sun is shining, I'll give it a go. Of course the web-specific features won't work (since there's no reliable internet connection aloft), but with a bluetooth GPS receiver paired with my Android phone, the core location services of the app should be operable. I'll  post my observations later...

In any case, I don't expect -- nor ever intended --  this web app to be particularly useful in the cockpit in-flight, given the obvious technical limitations. However, the app does have various features designed to be very useful for flight planning when on the ground. For example, automated METAR and TAF briefings "nearest" to your current location (or anywhere else, by clicking on the map). It also has full Google geosearch capabilities -- so you can find and navigate to your hotel once you've landed!

In the meantime, you can try the app for yourself. It is available here, with a Users' Guide here. Certain features require registration. If you already have a FlyLogical account, that will work across all apps including this one. If not, you can create one for free, here.

Hope you find it fun, and maybe even useful ! Feedback always welcome via the Comments section below.

Sunday, 16 March 2014

Bulldog Weight and Balance Android App

I've wrapped my recently-published Bulldog Weight & Balance web app into an Android mobile app. The functionality of the mobile app is identical to the web app, but with the added convenience of having an on-screen icon which you can simply tap to activate, rather than having  to remember which URL to browse to.
You can download the app for free from the Amazon AppStore by clicking here from your Kindle or Android device. Note: if you are using a general (non-Amazon) Android device rather than a Kindle, you will first need to download the Amazon Appstore App to your device from here (since the Bulldog Weight & Balance app is distributed via Amazon rather than Google).

Saturday, 15 March 2014

iNavCalc: a complete flight planning solution for SkyVector

Update 18 April 2017: completely re-written iNavCalc mobile apps enable export to SkyVector via GoogleMaps

Update 11 May 2014: my brand new Really Simple Moving Map web-app has full route import and export inter-operability with SkyVector (in addition to the iNavCalc / SkyVector interoperability described below)

A while back I posted about SkyVector and talked about some very basic inter-operability with iNavCalc via the command-string interface common to both.

I hadn't taken another look at SkyVector in almost two years. But when I did, I was pleased to see that they have now provided Plain Text Link URL functionality. I've now adapted this to enable complete two-way intercation between SkyVector and iNavCalc. This enables you to combine the full power of iNavCalc for performing route calculations, planning, and sharing, with the full power of SkyVector for viewing & editing the route on (global) aviation charts.

Here are some simple step-by-step instructions for converting routes between iNavCalc and SkyVector


Enjoy :)c

Saturday, 1 March 2014

Bulldog Triplog Template

When I bought my Bulldog almost ten years ago, the previous owner very kindly provided me with a Microsoft Excel file containing a Trip Log template which I've been using ever since. A few years ago, I modified the template to include the new information required for Fatigue Monitoring (e.g., undercarriage leg serial numbers etc). I've been printing-off the template (20 blanks at a time) and filling them in after each flight. These have then been used as the basis for my submission to DHSL for annual fatigue monitoring.

I recently migrated the Excel document to a GoogleDocs Spreadsheet (screenshot below). I'm pleased to make this template available to any Bulldog operators who may find it useful. You can find it here.

Simply print-off some copies as you need them and fill them in manually, or make a digital copy to your own GoogleDrive (if you have a Google account), and customise to your own needs (e.g., type-in your particulars such as aircraft registration, undercarriage leg serial numbers, etc), then print-off copies as you need them.

For convenience, the template incorporates hyperlinks to my Bulldog Weight & Balance Calculator, my Bulldog Fatigue Index Calculator, and my Bulldog Checklist, all freely-available to anyone who finds them useful.


Friday, 28 February 2014

Long Live the File-System !

If you have spent much time building mobile apps -- or even using them -- you will know how painful it is to work around the lack of consistency regarding the treatment of file-systems across the various platforms. iOS is the worst. Last time I looked in any detail, the iOS file-system was heavily locked-down such that one is basically confined to the very limited sub-file-system associated with a given app: making it almost impossible to flexibly share files across apps, one of the best things about the file-system in the first place !

Android and Windows Phone 8 are better, but neither is as simple and effective as the good old desktop (or laptop). Perhaps that's one of the reasons why almost half of (the many thousands of) iNavCalc users, are still routinely using the "old-fashioned" desktop (laptop) web-browser version of the app (as opposed to the mobile versions). With the desktop (or laptop) browser, it is trivially simple, for example, to import and export GPX route files (via the Import/export button on the web-form), which happens to be one of the most commonly used features of the software.

I must admit I was a little surprised by all this. I had sort of assumed that the mobile versions of iNavCalc would rapidly outweigh the desktop version in terms of usage volume. But a year or so after releasing the mobile versions, the desktop still commands 50% (or so) of the daily action.

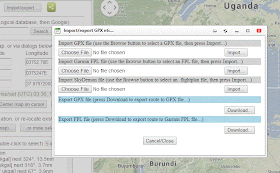
So, given these steady usage volumes on the desktop, I thought it would be good to spend just a little bit of time on improving the desktop version of iNavCalc. As such, and making good use of the file-system, I've enhanced the route file import/export functionality. Specifically, you can now do the following:

  • Import a GPX route file (this functionality was already present)
  • Import a Garmin FPL route file
  • Import a SkyDemon ".flightplan" route file
  • Export route to a GPX file (this functionality was already present)
  • Export route to a Garmin FPL file

These functions are all available via the Import/Export popup, as illustrated in the screenshot below.


Of course with the mobile versions of iNavCalc,  there is a workaround: namely exchanging files via email and via the Cloud storage functionality....but sometimes you can't beat the good old file-system in terms of simplicity and convenience. 

I  note in passing that the latest version of ChromeOS has a rather usable file-system. I was able to import/export route files via iNavCalc on the ChromeOS/Browser, with the same ease as I'm used to doing on Windows :)

Enjoy !


Sunday, 23 February 2014

Revenge of the Drones

Alas, my beloved quadcopter - complete with GoPro Hero 2 - featured in my recent post, has been lost at sea. It was unable to fight against the strong winds that carried it out to sea from the launch site in the Ramsey playing fields (Isle of Man).  Despite my best efforts to steer it to safety, the Irish Sea has claimed it.

An expensive lesson in the perils of flying beyond the weather limits of the aircraft...

Saturday, 22 February 2014

Bulldog Weight & Balance

I did some instrument flying refresher training the other day with an instructor plus a bunch of (heavy) documentation on-board. Got me thinking about weight & balance. Normally I fly solo so am well within the loading limits of my Scottish Aviation Bulldog, and hence I don't need to check routinely.

Anyway, when I was calculating the loading and checking against the charts and graphs in the Pilots Operating Manual, it struck me that this would be a very good example of a calculation well-suited to a web-app.

So I put one together (see screenshot below) and have published it for general use. You can find it here.

It is free to use. If you register with FlyLogical (also free), you can save (and retrieve) your settings across sessions.

Hope you find it useful.

Saturday, 25 January 2014

Attack of the Drones

My first attempts at shooting videos from a GoPro camera mounted on a quadcopter drone

Equipment list:


  • Walkera QR X350 quadcopter UAV ("drone") with GPS and compass
  • GoPro Hero 2
See pictures below.

Location: 

Laxey football pitch, Laxey, Isle of Man, British Isles

Conditions: 

Gusty

Videos:


Comments:


Profile for both flights: (1) manual take-off (via RC transmitter); (2) switch to autopilot stabilised mode after a few seconds airborne; (3) fly around a bit with guided steering inputs (via RC transmitter), whilst remaining in autopilot stabilised mode; (4) switch to auto-land mode whereby autopilot takes full control and lands the drone at point of take-off (GPS-driven).
   
The gusty conditions meant that the drone's autopilot was making frequent attitude and positional corrections, so the videos are not ultra smooth. That said. even without an anti-vibration camera mount, the quality is pretty good.

The auto-land feature was enabled. Even so, the landings were quite heavy: but perfectly survivable by both the drone and the GoPro.


Pictures


Wednesday, 1 January 2014

iNavCalc Data Sources

Updated 19 February 2015 to include openAIP.net source

Here is the current list of sources where iNavCalc gets its data. You will note that some sources are official, but since FlyLogical is not an official (re-)distributer of such data, all FlyLogical web-pages and apps carry a warning and disclaimer about not relying on the data without reverting to the original official sources.


  • METARs and TAFs:   US National Center for Atmospheric Research (NCAR) under sponsorship of the Federal Aviation Administration (FAA). This is an official data source. URL:  http://weather.aero 
  • NOTAMs: US FAA Aeronautical Information Data Access Portal (AIDAP). This is an official data source.
  • Atmospheric temperatures and pressures used in PLOG calculations: same source as METARs for surface data, then application of standard atmosphere model to extrapolate from surface measurements to flight altitudes. For each waypoint, data from the nearest METAR reporting station is used, so results must be considered as approximate.
  • Winds-aloft used in PLOG calculations: same source as METARs for surface data, then application of boundary layer model to extrapolate from surface measurements to flight altitudes (see http://es.ucsc.edu/~jnoble/wind/extrap/index.html ). For each waypoint, data from the nearest METAR reporting station is used, so results must be considered as approximate. Note: previous versions of iNavCalc utilised the NWX web-service ( http://www.navlost.eu/aero/nwx_help ) for deriving winds-aloft forecasts from the NOAA GFS models ( http://www.ncdc.noaa.gov/data-access/model-data/model-datasets/global-forcast-system-gfs ). However the NWX service has been intermittent of late, and no longer seems to be actively supported. As such, the alternate method of extrapolating from METAR surface winds has been adopted. This approach must be understood to be approximate,  not least since the boundary layer model is itself approximate. Moreover, an average value of 0.1 is assumed for the surface friction parameter in the model, thereby not taking account of local variations.
  • Geomagnetic declination: a local implementation of the World Magnetic Model (WMM), developed jointly by the National Geophysical Data Center (NGDC, Boulder CO, USA) and the British Geological Survey (BGS, Edinburgh, Scotland) . URL: http://www.ngdc.noaa.gov/geomag/WMM/DoDWMM.shtml
  • Solar angle calculations: local model based on Earth-Sun orbital model
  • Airport database: originally derived from the OurAirports.com community-maintained database, complemented thereafter by FlyLogical and by iNavCalc users
  • NAVAIDs database: originally derived from the OurAirports.com community-maintained database, complemented thereafter by  FlyLogical and by iNavCalc users
  • NAVCOM frequencies: originally derived from the OurAirports.com community-maintained database, complemented thereafter by FlyLogical and by iNavCalc users, and since 19 February 2015, automatically updated via openAIP.net on a weekly basis