*** DISCLAIMER ***
I have no medical training. Nothing presented here should be considered in any way as informative from a medical point-of-view. This is simply an exercise in image analysis via Deep Learning using MATLAB, with lung X-rays as a topical example in these times of COVID-19.
INTRODUCTION
In this Part 6 in my series of blog articles on exploring Deep Learning applied to lung X-rays using MATLAB, I bring together the results of the analysis of Parts 1, 2, 3, 4 & 5, and suggest a candidate set of composite models which are particularly suited to the task. I also present a live website whereby anyone can try these composite models by uploading an X-ray image and receiving results on-the-fly. Finally, all the underlying trained networks presented in this series of articles have been posted-up to GitHub (in MATLAB and ONNX formats). They are openly available for anyone wishing to experiment with them.
COMPOSITE MODELS
After much trial-and-error experimentation with the models presented in Part 3 in combination with the grad-CAM analysis of Parts 4 & 5, the following two composite models can be considered as being quite effective.
MODEL 1
This is based on a combination of the four-class networks (from Experiment 4) in Parts 1 and 3, with grad-CAM Discrimination Filtering from Part 5. Specifically, the model comprises the following steps (where the network names refer to the names of the underlying pretrained networks used as the basis for the Transfer Learning):
- Apply (i) alexnet; (ii) vgg16; (iii) googlenet(original); and (iv) googlenet (places) (from Experiment 4) to the X-ray-image-under-test. Each network will generate a score for each of the possible four labels [HEALTHY, BACTERIA, COVID, OTHER-VIRUS].
- Generate a grad-CAM image map for each of the networks (i)--(iv) in Step 1 using the technique presented in Part 4.
- Apply (a) googlenet; (b) darknet19; and (c) mobilenetv2 from Part 5 to the four grad-CAM images from Step 2. From the results for each grad-CAM image, assign a weighting factor determined as follows: if the majority of (a), (b), (c) are in agreement with INSIDE_LUNGS, set the weighting factor to 0.8 (rather than to 1 because the grad-CAM Discrimination Filter classifiers aren't perfectly accurate). If the majority of (a), (b), (c) are in agreement with OUTSIDE_LUNGS, set the weighting factor to 0.2 (rather than to 0 because the classifiers aren't perfectly accurate). If the majority of (a), (b), (c) are in agreement with RIBCAGE_CENTRAL, set the weighting factor to 0.5 (i.e., mid-way). In all other cases, set the weighting factor to 0.3 (i.e., ambiguous).
- Multiply each of the scores from Step 1 by the respective weighting factor from Step 3. This will give a grad-CAM weighted score per label per network.
- Take the average of the scores from Step 4 across all networks to give an average score per label. Renormalize these average scores so that they add up to one.
- Take the maximum of the resulting normalised averaged scores from Step 5, then assign the output classification to the label corresponding to the maximum score. This will give the resulting class from HEALTHY, BACTERIA, COVID, or OTHER-VIRUS with an accompanying score.
MODEL 2
- Apply (i) darknet19; (ii) resnet101; (iii) squeezenet; and (iv) resnet18 (from Experiment 1) to the X-ray-image-under-test. Each network will generate a score for each of the possible two labels [YES (pneumonia), NO (healthy)].
- Apply the identical approach to Steps 2--4 in MODEL 1 (above) to give the grad-CAM weighted score per label per network.
- Take the maximum of the grad-CAM weighted scores per label per network from the previous step across all networks to give a maximum score per label. Renormalize these maximum scores so that they add up to one.
- Take the maximum of the resulting normalised maximum scores from the previous step, then assign the output classification to the label corresponding to the maximum score. This will give the resulting class from YES or NO with an accompanying score.
- If the result is NO, the process terminates with the overall result of HEALTHY (plus accompanying score). If the result is YES, continue to the next step.
- Apply (i) vgg19; (ii) inceptionv3; (iii) squeezenet; and (iv) mobilenetv2 (from Experiment 2) to the X-ray-image-under-test. Each network will generate a score for each of the possible two labels [BACTERIA, VIRUS].
- Apply the identical approach to Steps 2--4 in MODEL 1 (above) to give the grad-CAM weighted score per label per network.
- Take the average of the grad-CAM weighted scores per label per network from the previous step across all networks to give an average score per label. Renormalize these average scores so that they add up to one.
- Take the maximum of the resulting normalised average scores from the previous step, then assign the output classification to the label corresponding to the maximum score. This will give the resulting class from BACTERIA or VIRUS with an accompanying score.
- If the result is BACTERIA, the process terminates with the overall result of BACTERIA (plus accompanying score). If the result is VIRUS, continue to the next step.
- Apply (i) resnet50; (ii) vgg16; (iii) vgg19; and (iv) darknet53 (from Experiment 3) to the X-ray-image-under-test. Each network will generate a score for each of the possible two labels [COVID, OTHER-VIRUS].
- Apply the identical approach to Steps 2--4 in MODEL 1 (above) to give the grad-CAM weighted score per label per network.
- Take the average of the grad-CAM weighted scores per label per network from the previous step across all networks to give an average score per label. Renormalize these average scores so that they add up to one.
- Take the maximum of the resulting normalised average scores from the previous step, then assign the output classification to the label corresponding to the maximum score. This will give the resulting class from COVID or OTHER-VIRUS with an accompanying score. The process is complete.
Taken together, MODEL 1 and MODEL 2 provide two alternate paths to the classification of the lung X-ray-image-under-test. If the resulting classifications are in agreement, this represents the final classification, with a score given by the average of the scores for the two models. If the resulting classifications are not in agreement, the classification with the higher score can be considered as representing the final classification (with its corresponding score).
These two composite models were hand-crafted (essentially by trial-and-error). They perform well on the validation images. Of course there are many other combinations of networks (from Part 3) that could be considered.
DEPLOYMENT
The trial-and-error experimentation to determine the combination of the Deep Neural Networks in MODELS 1 & 2 -- as well as the training of all the underlying Deep Neural Networks (via Transfer Learning), and the grad-CAM Discrimination Filtering -- was all performed in MATLAB.
The next step was to expose the resulting models in a form that they are generally accessible (for anyone to experiment with) without the need for MATLAB. That is the topic of this section.
MATLAB Compiler
The approach taken was to utilise the MATLAB Compiler (and the accompanying MATLAB Compiler SDK) to generate a shared library (specifically a Microsoft dotnet library) which contains all the code required to run the models.
RESTful Web Service
This library was then integrated into a RESTful Web Service application (written in C#), and deployed on a web server (Windows / IIS).
Web Application Front-End
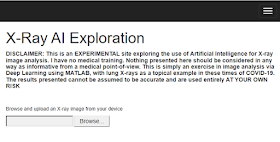
The RESTful Web Service is exposed to users via a simple ASP.NET Web Application (front end) hosted on a Windows server. Here is the URL and a screenshot of the landing page...
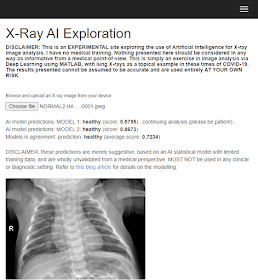
Simply upload a lung X-ray (cropped with no borders, and confined to the rib-cage as far as possible) via the web page, and wait (up to a few minutes) for the analysis to proceed. The results look like this:
EXPORTED MODELS
All the Deep Neural Networks presented in Part 3 and Part 5, including the subset of models used in the deployed composite MODELS 1 & 2 presented above, have been exported in MATLAB format and in ONNX format. Please feel free to retrieve them from my github repositories (here for MATLAB format, and here for ONNX format) for use in your own experiments.
POTENTIAL NEXT STEPS
- Try different combinations of underlying models to generate composite models which perform better than MODELS 1 & 2 presented here. Owing to the large number of possible combinations, this search/optimisation should be performed in an automated manner (rather than manually by trial-and-error as applied here).
- Re-train and compare all the models with larger image datasets whenever they become available. If you have access to such images, please consider posting them to the open source COVID-Net archive here.


Ataşehir eskort
ReplyDeleteKadıköy eskort
Bostancı eskort
Ümraniye eskort
İstanbul eskort
Anadolu Yakası eskort
eskort bayan
WG6
Ataşehir eskort
ReplyDeleteKadıköy eskort
Bostancı eskort
Anadolu Yakası eskort
H8F