
*** DISCLAIMER ***
I have no medical training. Nothing presented here should be considered in any way as informative from a medical point-of-view. This is simply an exercise in image analysis via Deep Learning using MATLAB, with lung X-rays as a topical example in these times of COVID-19.
INTRODUCTION
This follows on from my previous post (Part 1) where I presented results of a preliminary investigation into COVID-19 lung X-ray classification using Deep Learning in MATLAB. The results were promising, but I did emphasise my main caveat that the Deep Neural Networks may have been skewed by extraneous information embedded in the X-ray images leading to exaggerated performance of the classifiers. In this post, I utilise the approach suggested here (another MATLAB-based COVID-19 image investigation) based on the Class Activation Mapping technique described here to determine the hotspots in the images which drive the classification results. This verification analysis mirrors that presented in the original COVID-Net article (where they utilise the GSInquire tool for similar purpose). As before, my approach is to use MATLAB for all calculations, and to provide code snippets which may be useful to others..
GOTCHA: In Part 1 I was using MATLAB version R2019b. For this current investigation I upgraded to R2020a for the following reasons:
- The mean function in R2020a has an additional option for vecdim as the second input argument, as required in the code I utilised from here
- The structure of the pre-trained networks e.g., googlenet which I use, has changed such that the class names are held in the Classes property of the output layer in R2020a rather than in the ClassNames property as in R2019b. I could have simply modified my code to workaround the difference, but given the first reason above (especially), I decided to upgrade the versioning (and hopefully this will avoid future problems).
CLASS ACTIVATION MAPPING
Dataset
Using the validation results from the Deep Neural Net analysis in Example 4 of Part 1 provides a set of 44 sample X-rays and predicted classes, 11 from each of the four classes in question: "healthy", "bacteria", "viral-other", and "covid". By choosing Example 4, we have selected the most challenging case to investigate (i.e., the 4-class classifier trained on relatively few images compared with Examples 1--3, each of which were 2-class classifiers trained on more images than Example 4).
The images are contained in validationImages (the validation imageDatastore) from Example 4 and the trained network (from Transfer Learning) is contained in the netTransfer variable. The task at hand is to analyse the Class Activation Mappings to determine which regions of the X-rays play the dominant role in assessing the predicted class.
The images are contained in validationImages (the validation imageDatastore) from Example 4 and the trained network (from Transfer Learning) is contained in the netTransfer variable. The task at hand is to analyse the Class Activation Mappings to determine which regions of the X-rays play the dominant role in assessing the predicted class.
Code snippet
The code which performs the Class Activation Mapping using the netTransfer network (in a loop around all 44 images in validationImages) is adapted directly from this example, and presented in full as follows (the utility sub-functions -- identical to those in the example -- are not included here):
netName = "googlenet";
classes = net.Layers(end).Classes;
layerName = activationLayerName(netName);
for i=1:length(validationImages.Files)
h = figure('Units','normalized','Position',[0.05 0.05 0.9
0.8],'Visible','on');
[img,fileinfo] = readimage(validationImages,i);
im=img(:,:,[1 1 1]); %Convert from grayscale to rgb
imResized = imresize(img, [224 224]);
imResized=imResized(:,:,[1 1 1]); %Convert to rgb
imageActivations = activations(net,imResized,layerName);
scores = squeeze(mean(imageActivations,[1 2]));
fcWeights = net.Layers(end-2).Weights;
fcBias = net.Layers(end-2).Bias;
scores = fcWeights*scores + fcBias;
[~,classIds] = maxk(scores,4); %since 4 classes to compare
weightVector = shiftdim(fcWeights(classIds(1),:),-1);
classActivationMap = sum(imageActivations.*weightVector,3);
scores = exp(scores)/sum(exp(scores));
maxScores = scores(classIds); labels = classes(classIds);
[maxScore, maxID] = max(maxScores);
labels_max = labels(maxID);
CAMshow(im,classActivationMap)
title("Predicted: "+string(labels_max) + ", " +
string(maxScore)+" (Actual: "+
string(validationImages.Labels(i))+")",'FontSize', 18);
drawnow
end
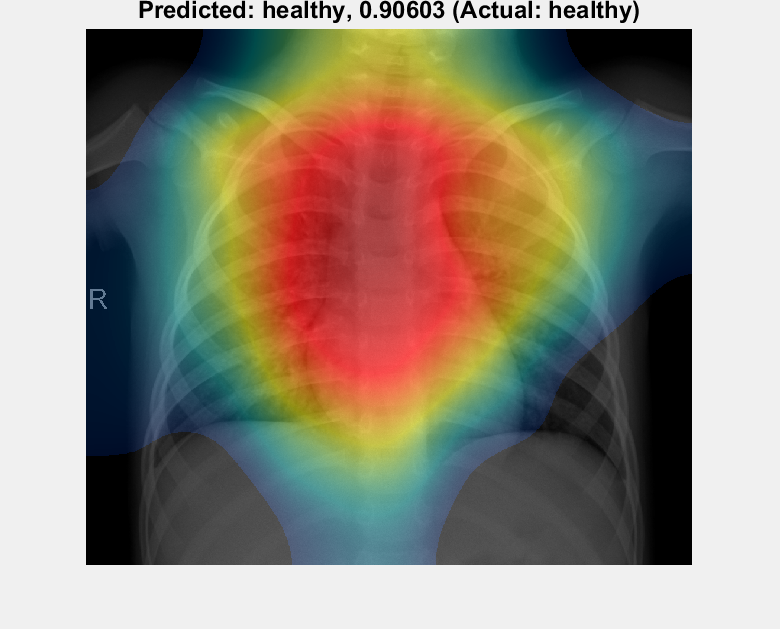
Results & Conclusions
The resulting Class Activation Maps for all 44 validation images are shown below. The title of each image contains the predicted class (plus the corresponding score) and the actual class. Since the network is not 100% accurate, some of the predictions are incorrect. However, it is clear from these image activation heat-maps that the networks are generally using the detail within the lungs (albeit with a few use regions further away) rather than extraneous factors and artefacts (embedded text, pacemakers, etc.) to make the predictions. This is an encouraging result, successfully countering the caveat from Part 1 regarding the possibility of the classifier performance being exaggerated by such artefacts, and is in line with the conclusions reported here and here from similar studies.Class Activation Maps


No comments:
Post a Comment